Entity-relationship Diagram (ERD)
Entity-relationship Diagram
Google Cloud Cortex Data Foundation
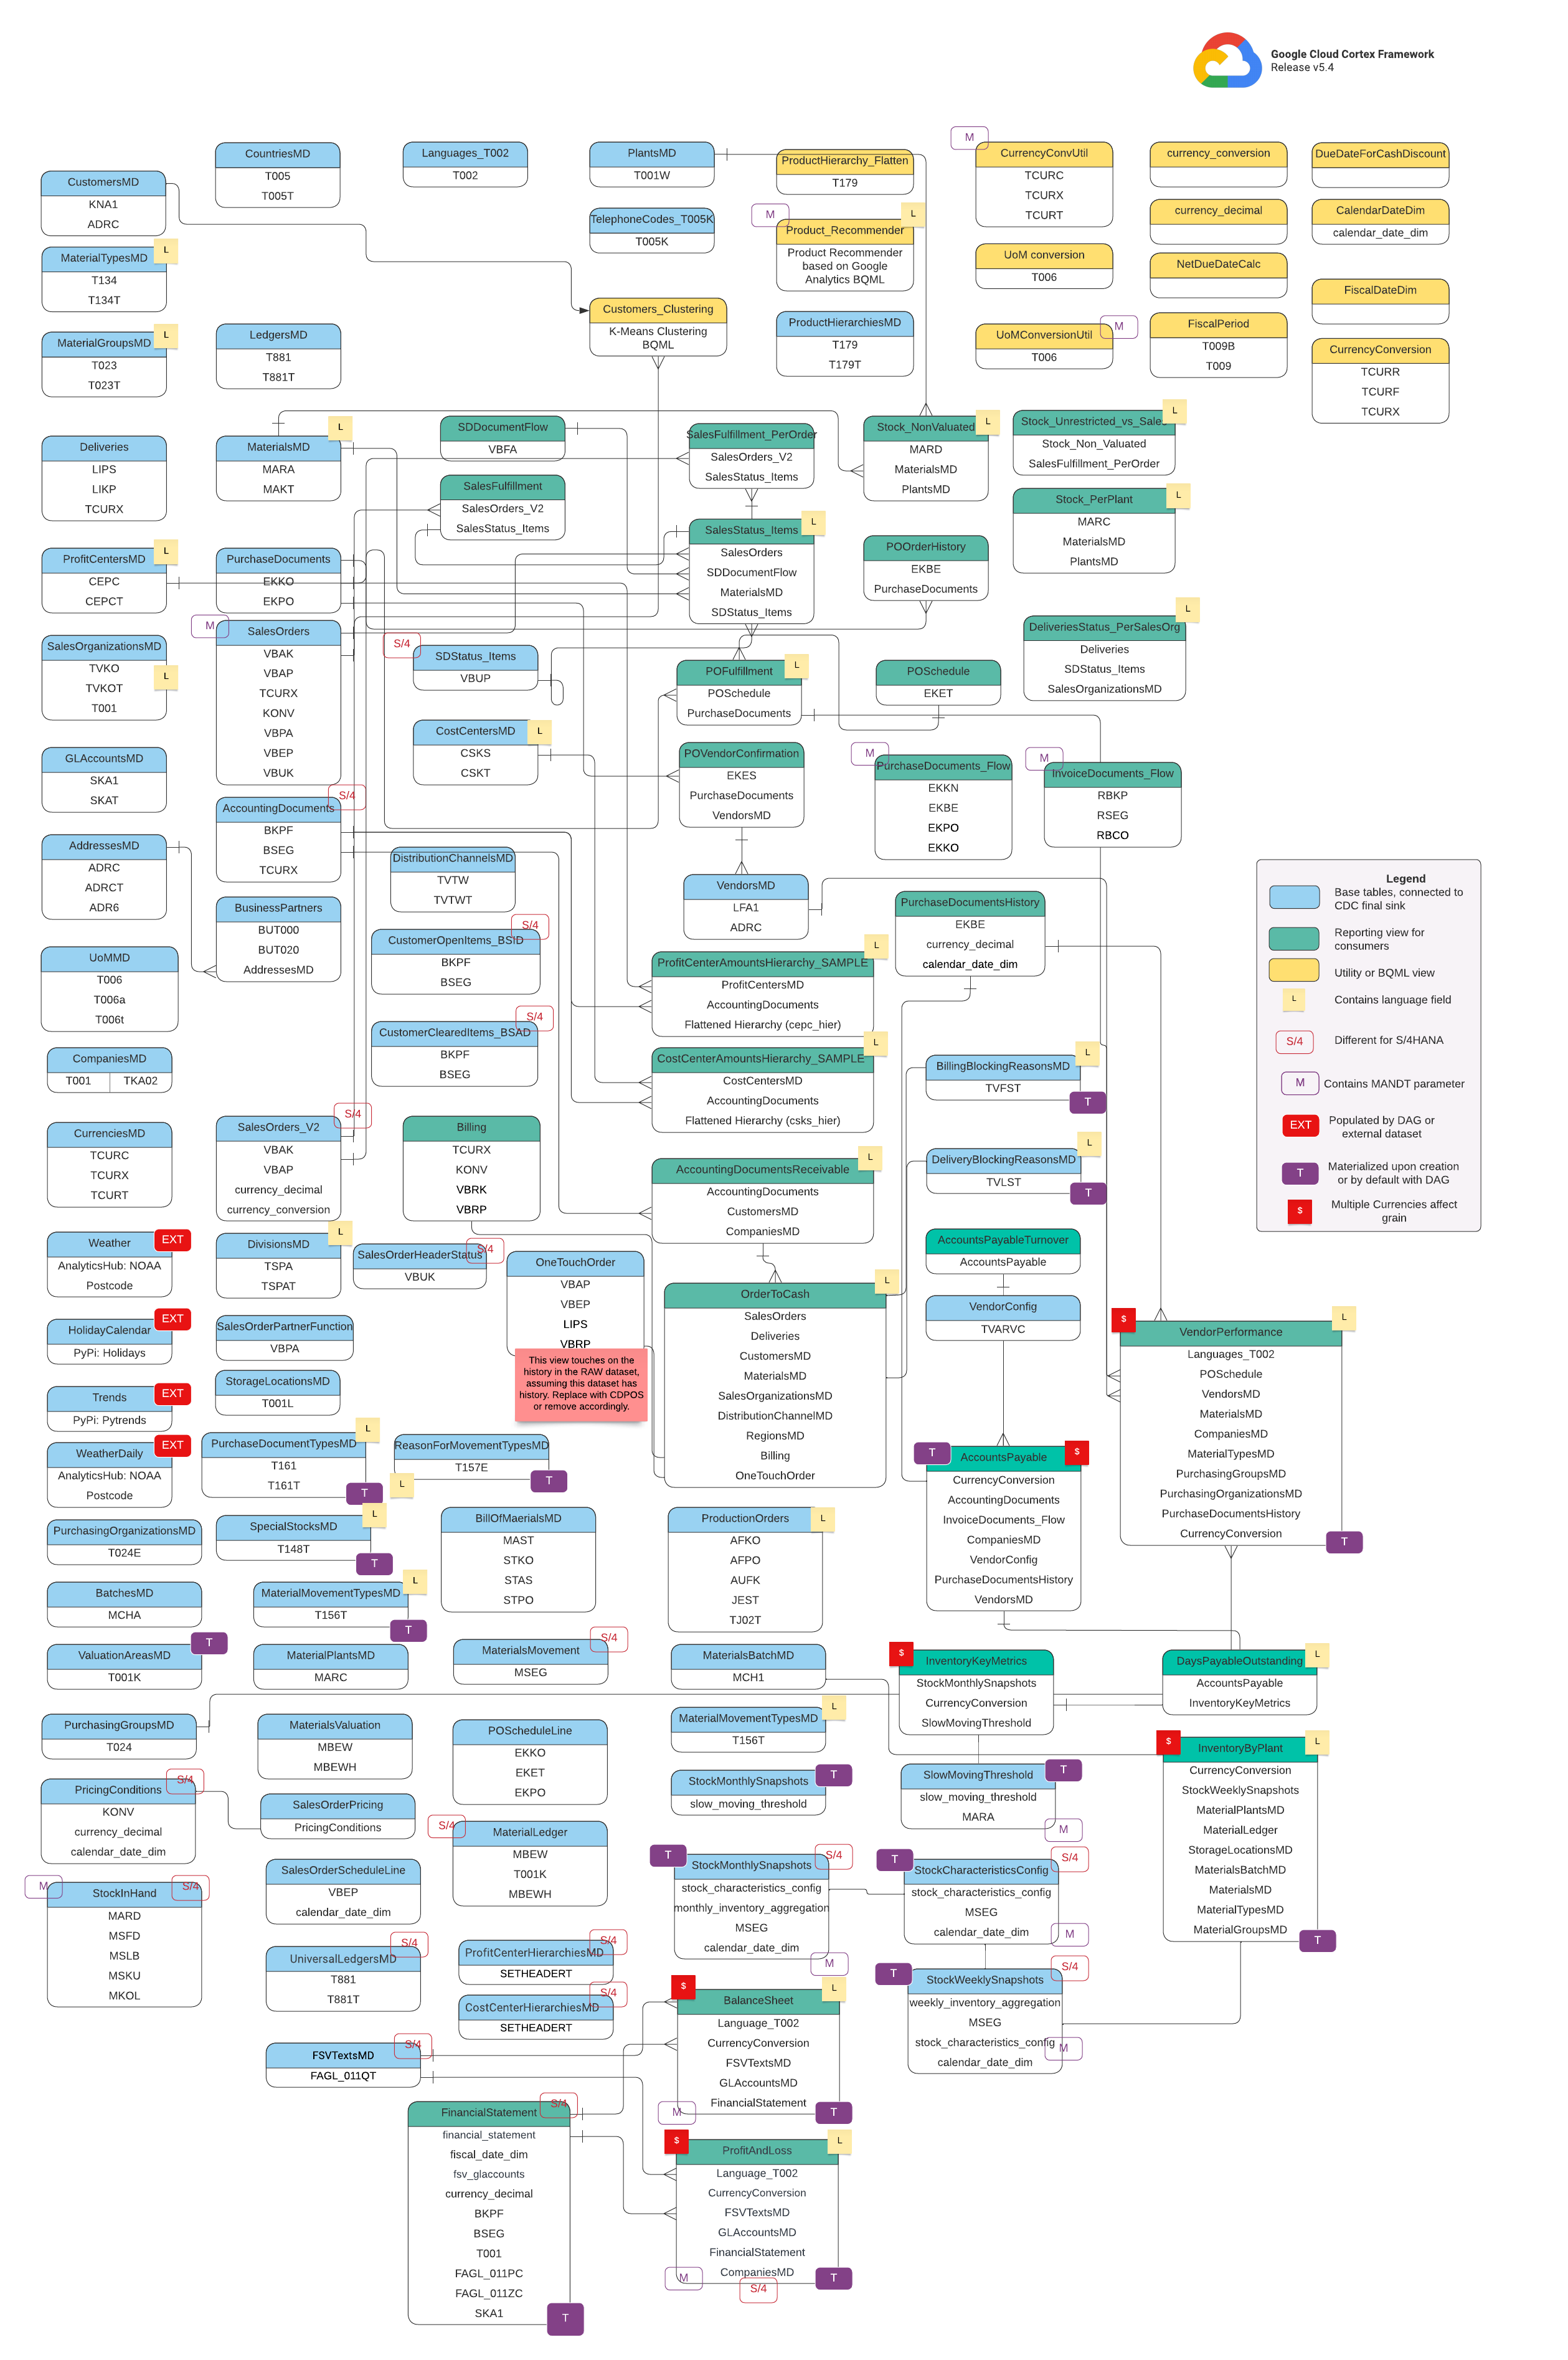
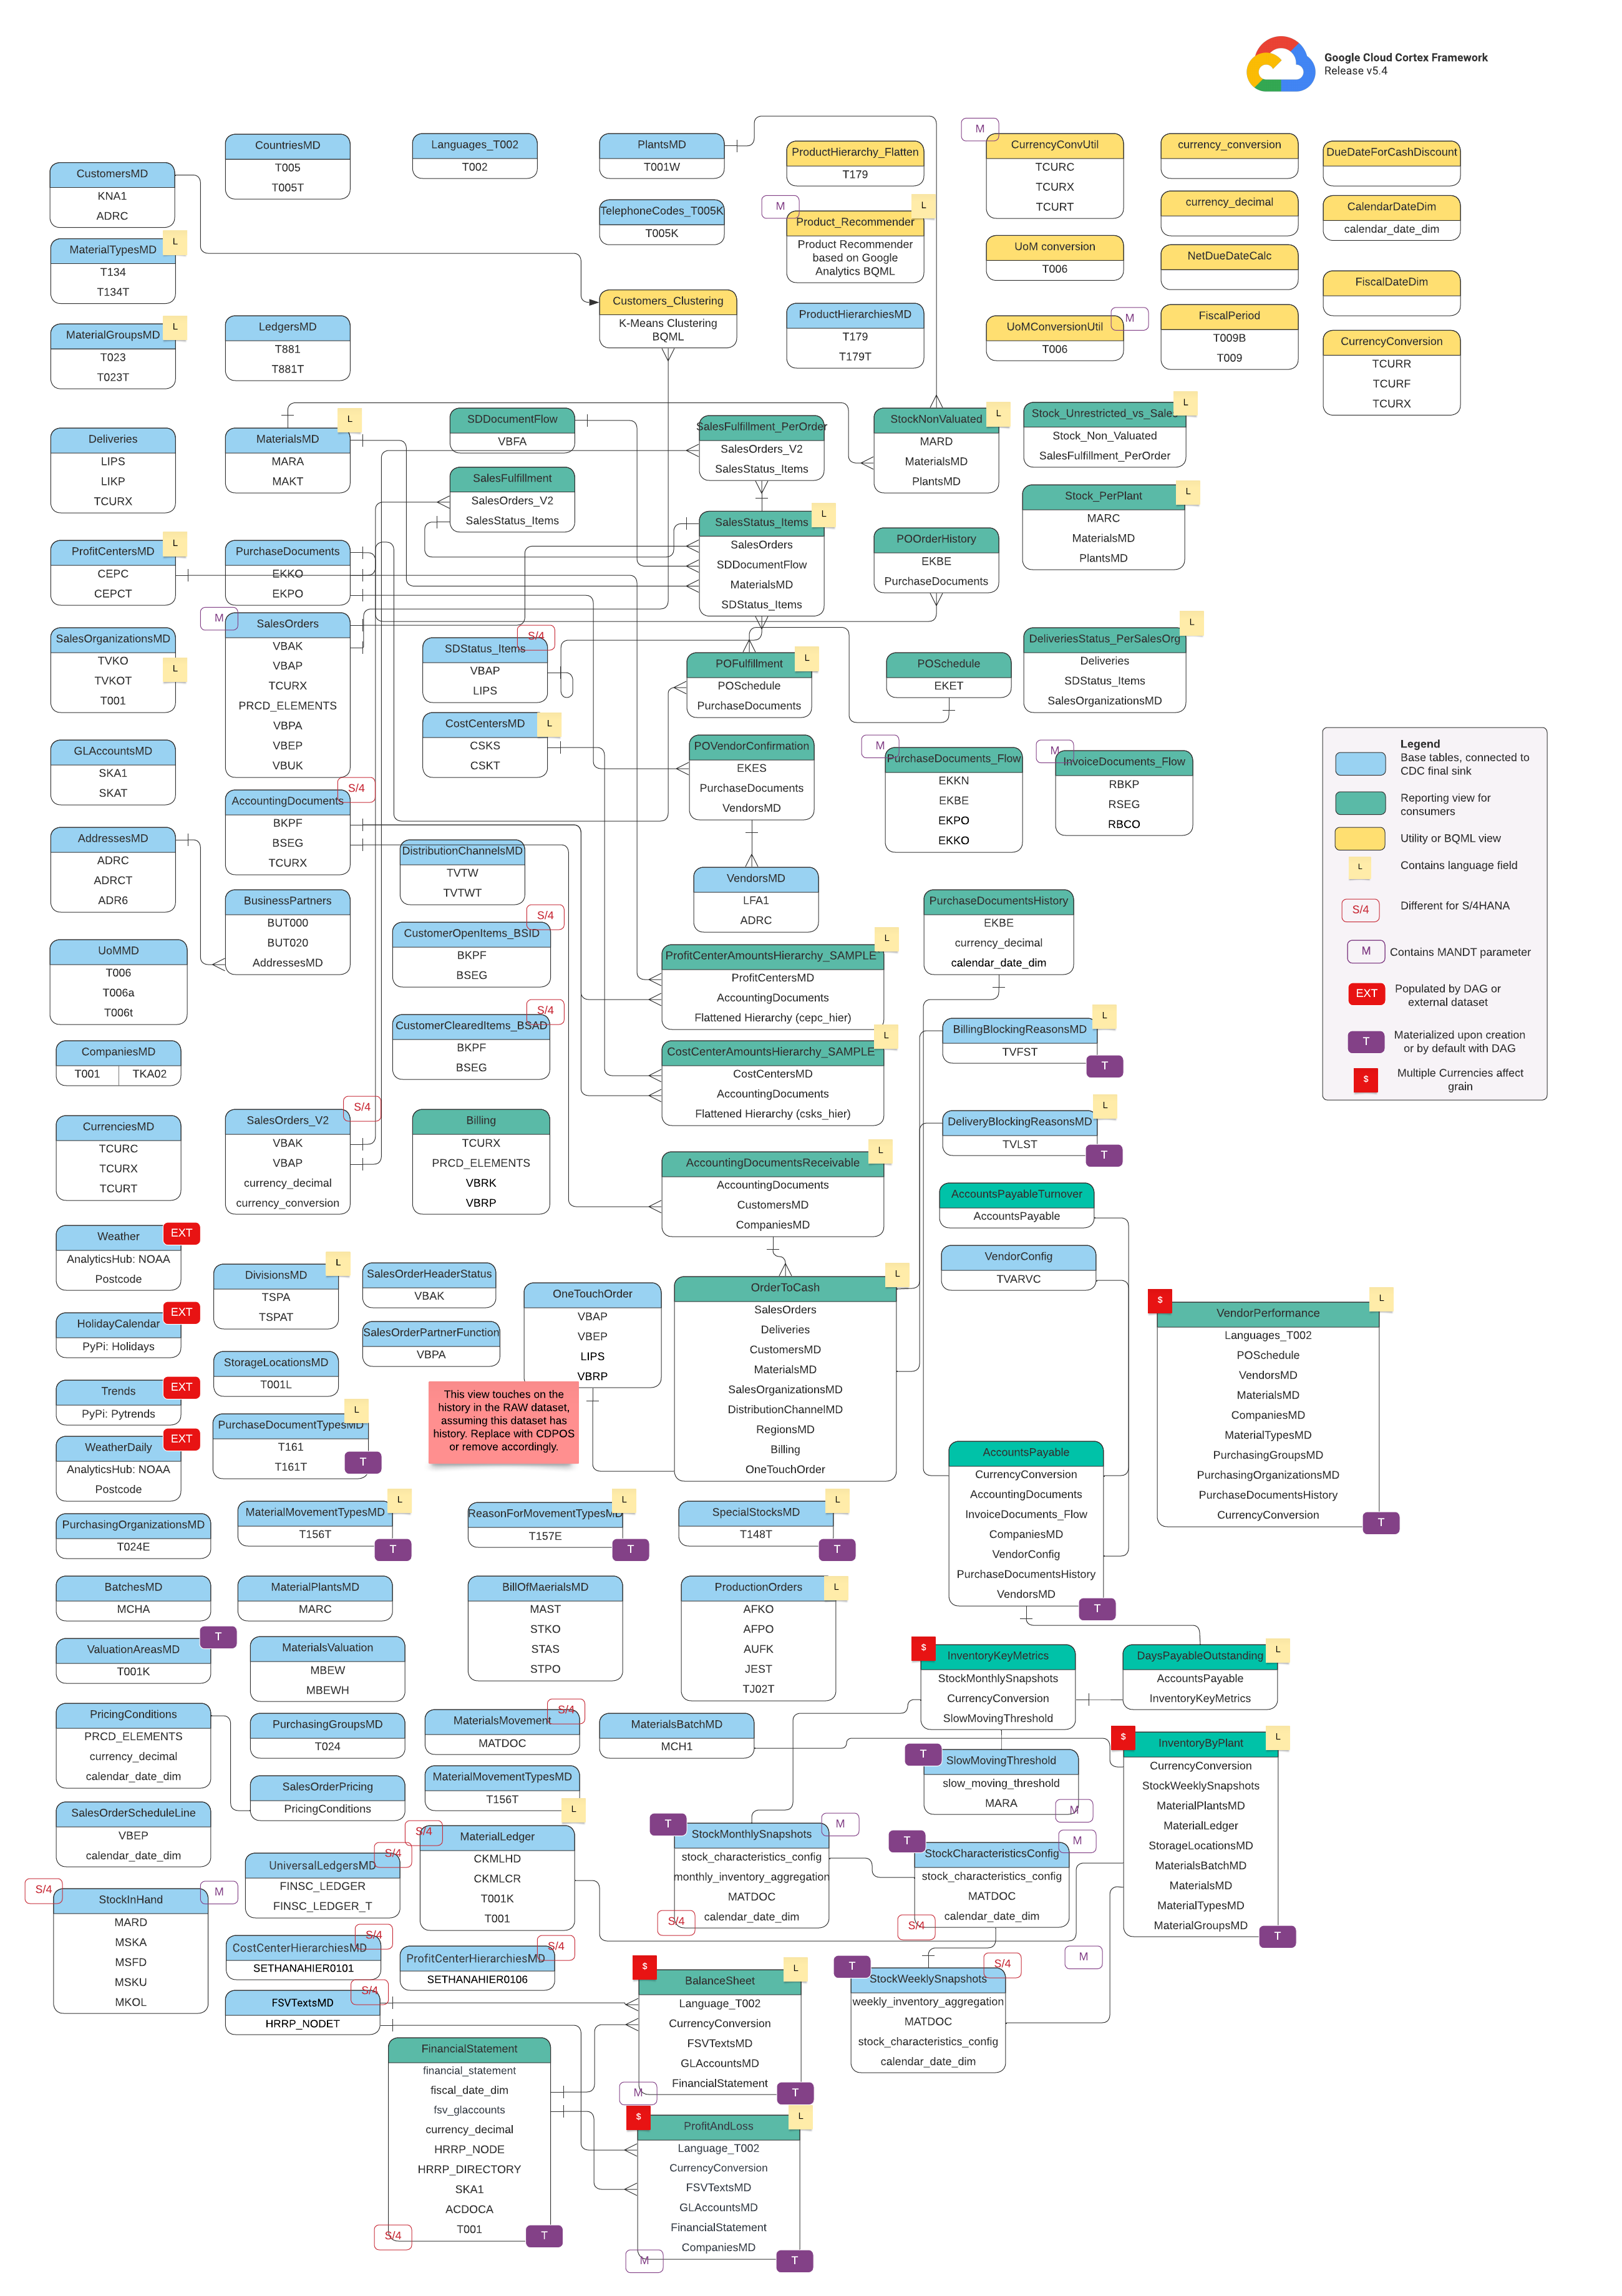
Google Cloud Cortex Foundation for SAP, has two ERD, one for SAP ECC Systems and one for SAP S/4HANA Systems.
Concepts
The Google Cloud Cortex Framework entity-relationship diagram for SAP System is a complex and detailed representation of the relationships between the various entities in the SAP system. The diagram is divided into multiple functional areas, each of which is represented by a different color. The base views are the foundation of the diagram and are represented by blue tables. The reporting views are built on top of the base views and are represented by green tables. The bigquery ml models are used to generate insights from the data in the reporting views and are represented by yellow tables.
The base views are the most detailed level of data in the diagram and are typically sourced from the SAP tables.

The reporting views are more aggregated and are typically used for reporting purposes.

The bigquery ml models are used to generate insights from the data in the reporting views.

The difference between a base view and a reporting view is that the base view is the most detailed level of data, while the reporting view is more aggregated.
The base view is typically used for data analysis, while the reporting view is typically used for reporting purposes.
The ERD concepts that are used in the diagram include entities, relationships, and attributes.
Entities are the objects that are being represented in the diagram. Relationships are the connections between the entities. Attributes are the properties of the entities.
The Google Cloud Cortex Framework entity relationship diagram for SAP System is a valuable resource for understanding the relationships between the various entities in the SAP system.
The diagram can be used to identify the source of data for a particular report, to understand the relationships between different entities, and to generate insights from the data.